When an issue occurs, while using Remote Desktop Manager, our customer support technicians may ask you to turn on debugging and send the information back.
Any debug level other than zero will slow down the application and write a lot of information in the application logs. As soon as you have completed the diagnostics, you should revert back the debug level to zero.
The Ad hoc debugging method is sufficient in most cases, use the in-depth debugging method whenever you need to diagnose the startup or the initial connection.
-
In Remote Desktop Manager, open Help – Profiler, move the window aside to clear the main window.
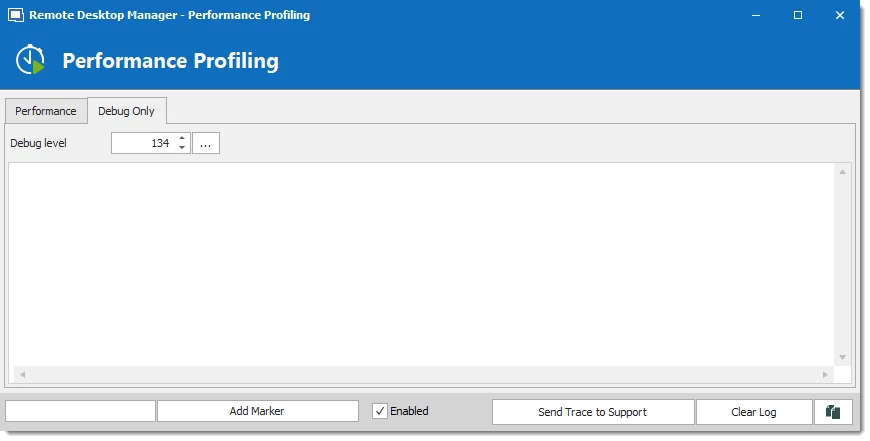
Performance profiling -
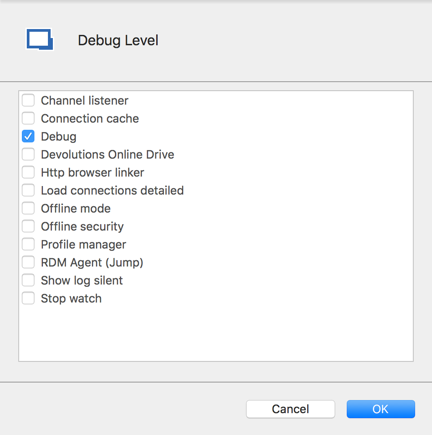
In the Debug only tab, click on the ellipsis button and activate the proper debug categories.
-
In Remote Desktop Manager, perform the action that is under investigation.
For timing session load times, please press Ctrl+F5 to invalidate the cache and perform a full refresh. You should see debug information appear in the profiler window.
Click on Send trace to Support.
In the following dialog, ensure you specify enough information to link the report to the appropriate ticket.
If the process was started from the forum include your forum username.
-
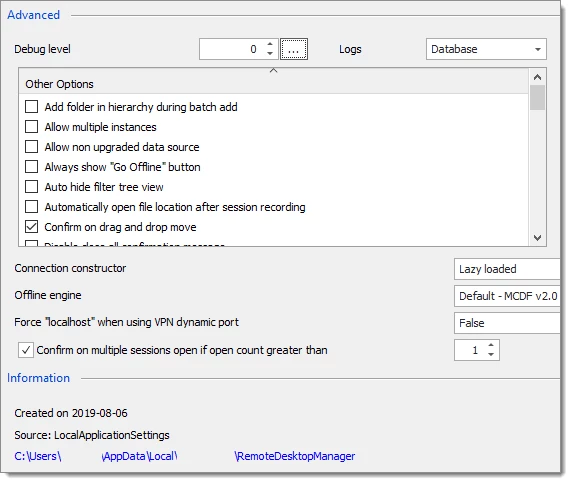
In Remote Desktop Manager open File – Settings – Advanced.
-
Click on the Debug level ellipsis button and activate the proper debug categories.
-
In the Information section, you will see a hyperlink to your configuration folder, press on it to have a file explorer window opened in that folder.
File – Settings – Advanced -
Close Remote Desktop Manager
As a preparatory phase, it would be best to clear existing logs to limit the scope of what will need to be analyzed.
Delete or rename files named RemoteDesktopManager.log, RemoteDesktopManager.log.db and RemoteDesktopManager.debug from your configuration folder.
Start Remote Desktop Manager.
Perform the action that is under investigation.
Open File – Settings – Advanced, set the Debug level to zero.
Close Remote Desktop Manager.
Package the *.log, *.log.db and *.debug files from your configuration folder and send them to us.
Use the debugging method whenever you need to diagnose the start-up or initial connection.
-
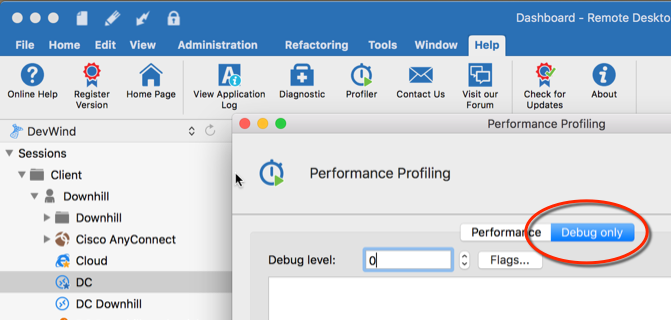
Start by clicking on Help – Performance profiling. Move the window aside to clear the main window of Remote Desktop Manager macOS.
-
In the Debug only tab, click on the ellipsis button and activate the proper debug categories.
-
In Remote Desktop Manager macOS, click on Flags to check what perform the action that is under investigation.
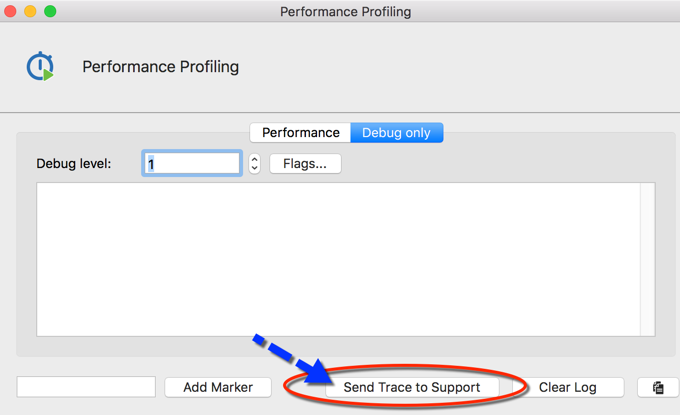
Performance profiling – Debug level -
Then, click on Send trace to support. In the following dialog, ensure you specify enough information to link the report to the appropriate ticket, if the process was started from the forum include your forum user name.
Send trace to support