Remote Desktop Manager Windows has a built-in profiler to diagnose connectivity issues with a data source. Displaying the Performance profiling window might slow down the operations on the data source. Proceed with care.
To diagnose startup issues, enable the Performance profiling parameter from the command line as described in Command line arguments.
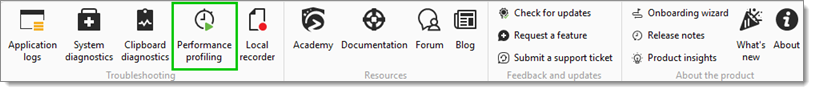
Select Help - Performance profiling.
Once the Performance profiling is opened, Refresh the data source. The data will appear in the window.
Holding the Ctrl key while performing the refresh should force a full reload of the data source, recreating the offline cache.
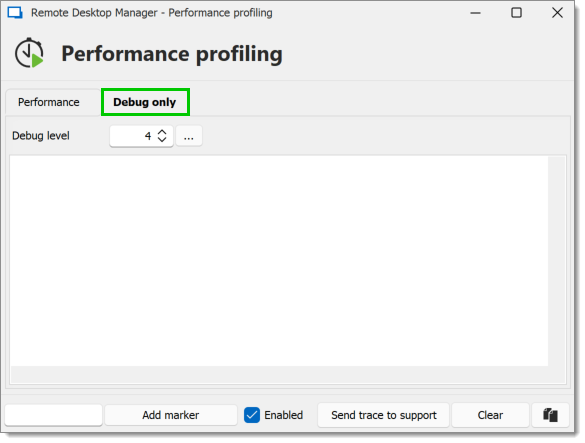
Click on Send trace to support to send the data logs to our customer support team. Add a marker when running multiple tests to separate them.
Select Help - Performance profiling.
Move the window to the side to display the Remote Desktop Manager main window and refresh the data source by using the refresh button or by using File – Refresh.
Holding the Ctrl key while performing the refresh will force a full reload of the data source, thereby ignoring the cache.
The Performance profiling data will appear in the window.
Click on Send Trace to Support to send the data logs to our customer support team. Add a Marker when running multiple tests to separate them.
To learn more about the Debug only tab, please see Debugging.
The Auto mode filters profiler output to only show operations that exceed a configurable time threshold (the Threshold (ms) field). This makes it much easier to spot slow operations without going through thousands of fast, normal entries.
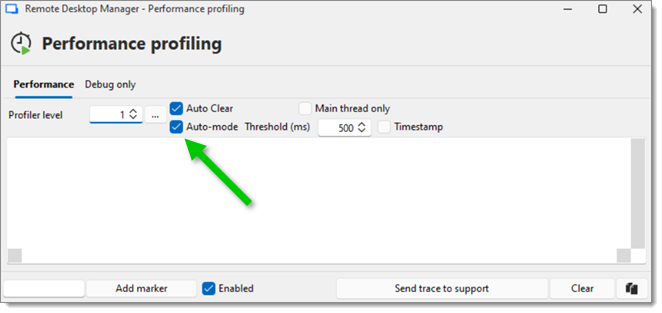
Auto-mode entries are visually marked with a middle dot prefix (·) in the viewer so they are distinguishable from entries triggered by an explicit profiler level.