There are two methods for configuring the failed request tracing:
Using the appcmd.exe command
| appcmd.exe set config -section:system.applicationHost/sites "/[name='Default Web Site'].traceFailedRequestsLogging.enabled:True" /commit:apphost |
| appcmd.exe set config -section:system.applicationHost/sites "/[name='Default Web Site'].traceFailedRequestsLogging.maxLogFiles:10" /commit:apphost |
| appcmd.exe set config -section:system.applicationHost/sites "/[name='Default Web Site'].traceFailedRequestsLogging.directory:%SystemDrive%\inetpub\logs\FailedReqLogFiles" /commit:apphost |
| appcmd.exe set config "Default Web Site" -section:system.webServer/tracing/traceFailedRequests /+"[path='*']" |
| appcmd.exe set config "Default Web Site" -section:system.webServer/tracing/traceFailedRequests /+"[path='*'].traceAreas.[provider='WWW Server',areas='Rewrite',verbosity='Verbose']" |
| appcmd.exe set config "Default Web Site" -section:system.webServer/tracing/traceFailedRequests /[path='*'].failureDefinitions.statusCodes:"400-599" |
Note that the steps above only apply to IIS 7.0 or later, and that the commands work best when cmd.exe is run as an administrator.
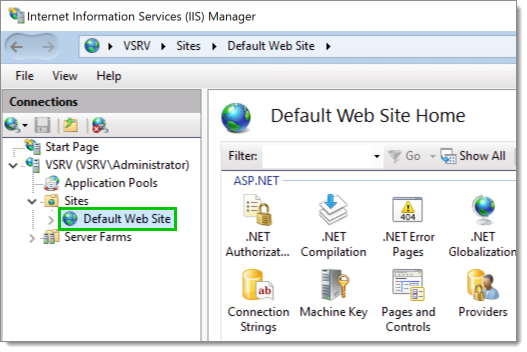
In IIS Manager, expand the root node, expand Sites, then select Default Web Site.
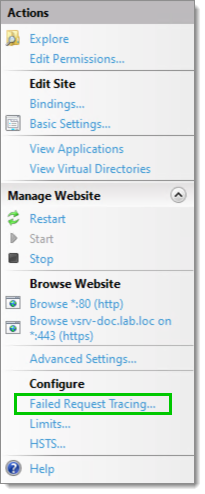
In the Actions pane on the right, select Failed Request Tracing.
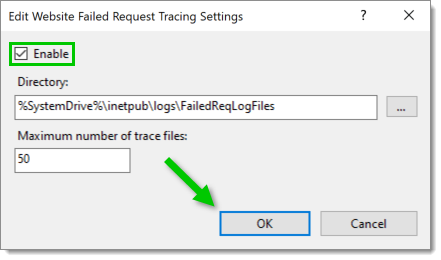
Check the Enable box (mandatory). The Directory target and Maximum number of trace files options can be customized (optional). Click OK when done.
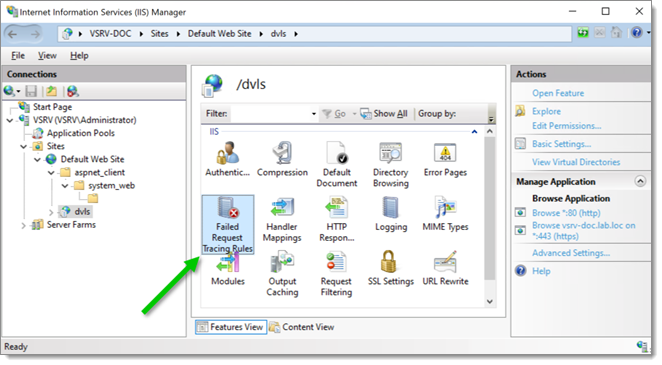
Expand Default Web Site, then select the website to be traced.
Double-click on the Failed Request Tracing Rules icon of the selected website.
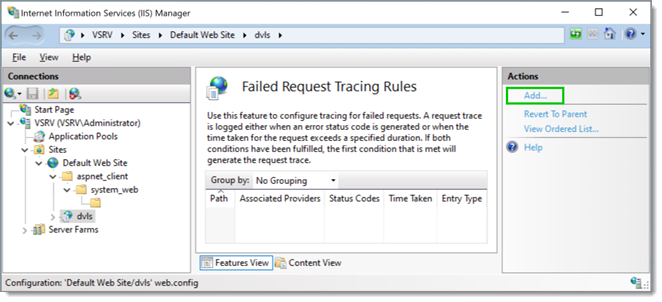
In the Actions pane on the right, click on Add to add a new rule.
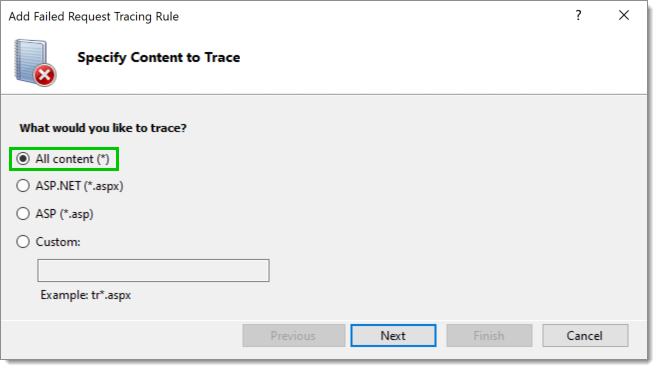
Select All content ()*, then click Next.
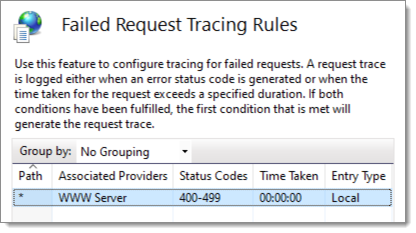
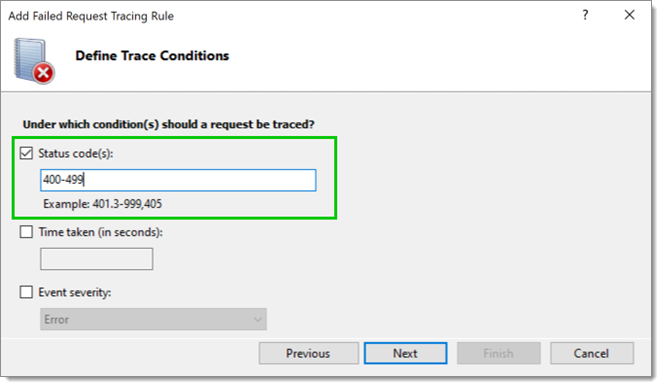
Check the Status Code(s) box, then enter the type of the status code to be traced. In this case, the Status code(s) is set to monitor everything from codes 400 to 599. Click Next when done.
Select the providers of the tracing. For each provider, set the Verbosity to Verbose and select all Areas. In this case, the WWW Server provider was selected.
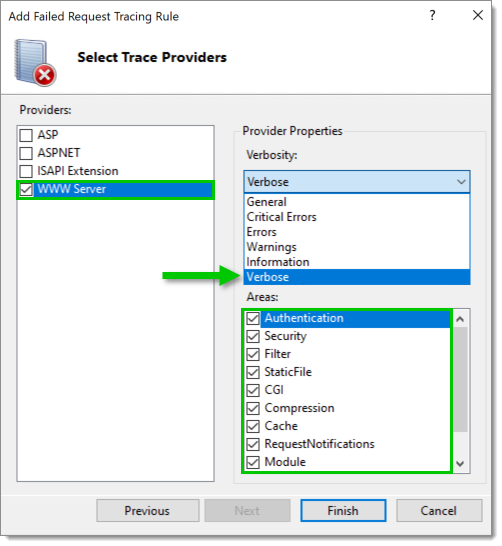
Click Finish. The tracing rule is now defined.