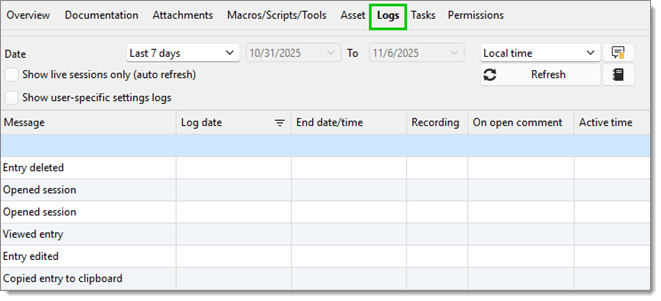
Similar to the Activity logs feature for data sources, the Logs dashboard tab contains all the actions executed on the selected entry. The information displayed can be refined by specifying a custom Date, a timeframe, or which sessions to log.
The Logs tab is only available for certain types of entries, such as sessions.
| TABS | DESCRIPTION |
|---|---|
| Message | What action was performed on the entry. |
| Log date | The log's creation date, i.e., when the user started interacting with the entry. |
| End date/time | The date or time the user stopped interacting with the entry. |
| Recording | Logs session recording. |
| On open comment | Comment(s) shown upon opening the entry, if any. |
| Active time | This information is only available for embedded mode sessions. The active time of your session, meaning the time at which your session was open in embedded mode and the time you were active on your session, will be recorded. If your session is open, but you are on the Dashboard tab, for example, and not on your session tab, no active time will be recorded. |
| Duration | This information is only available for embedded mode sessions. When sessions are open in embedded mode, the duration of the session will be recorded. This means that even if you are on the Dashboard tab, for example, and not actively working in your session, but your session tab is open, the session duration will be recorded. |
| On close comment | Comment(s) shown upon closing the entry, if any. |
| Data source user | The account email used at the data source level. |
| Entry user | Username at the entry level. |
| Machine user | Account name at the computer level. |
| Ticket # | The ticket number, if any. |
| Machine | The name or IP of the machine launching the connection. |
| Connection type | The connection type of the session, e.g., RDP, ARD, SSH Terminal, etc. |